
The value of Intellectual property (Read: Patents) is increasing in today’s technological world. The market, value, growth of any company depends on the technological prowess it has or in other words, the patent it has.
But, again what will keep the growth of any company “patent” or “number of patents”?
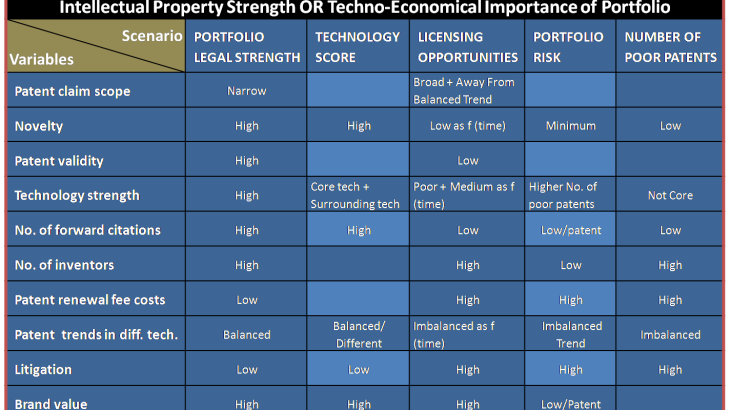
It has never been easy to define the relative value of a patent. There are numerous variables, which combine, depending on time and scenario to define the value of patent/patent portfolios.
Therefore, to take this debate head-on, we at KAnalysis tried to develop a matrix. This matrix upon evolution will help us to benchmark the relative value of patent quality & quantity.
For Patent Portfolios:
This chart will help in defining the potential scenario gain with respect to different dynamic variables.
Benefits from this chart
- Stronger Economic Growth
- Define Higher Stakeholder Value
- Avoid Patent Infringement Lawsuits
- Long Term Financial Performance
- Patent Performance Measurements (Patent Quality)
- Strategically Important Innovations
- Technology Priority (Core + Surroundings)
- Gaps Among Supporting Technologies
Steps undertaken before completing this matrix:
- Technology Landscaping / Technology Categorization
- Graphical Analyses of different Technology Clusters
Importance should be given to filling date rather than grant date for deciding trends
For Individual Patents:
Benefits from this chart
- Relative Patent Strength
- Patent Valuation
- Licensing Options
Steps undertaken before completing this matrix:
- Prior Art Search
- Claim Mapping Strength
- Backward/Forward Citation Value
- Litigation History
- Inventor History
- Brand Value Calculation
